 |
|
|
back
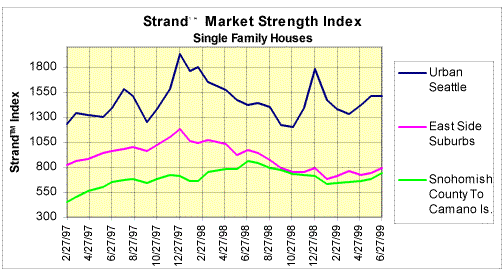
Dear Clients & Friends, The graph and tables below depict changes in market strength as measured by the Strand™ Index, for the single family housing market in urban Seattle, the East-side suburbs, and the Snohomish County/north to Camano Island areas. The time period covered is February of 1997 to the end of June, 1999. Note that the urban Seattle market tends to reflect higher demand and lower supply characteristics than the other market segments depicted, here. However, Seattle also tends to be more volatile, as well.
Regards,

© 1999-2003
|
|
| Home | Housing Update Letters | Strand™ Index | Links | |
| ©1999-2003 R.E. Rothstein | |