 |
|
|
back
The Anatomy of the Strand™ Index Graph Line
Dear Clients and Friends,
The makeup of a Strand™ Index graph line is easily understood. A high demand and a low supply in the market will push the index up. If the components of supply increase or demand decline, the Strand™ Index will fall, immediately....typically weeks, or more, before it is recognized through field experience.
Over time, we have come to learn more about how the real estate market functions by tracking the Strand™ Index, and how following the index's graph line relates to the lives of real estate professionals and their clients.
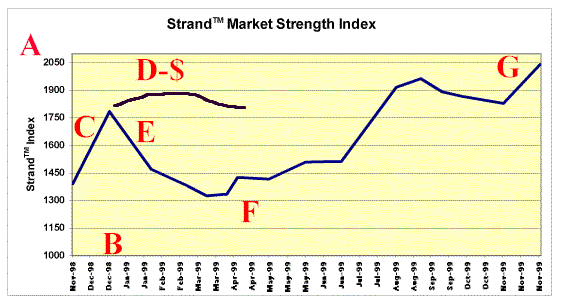
One of the goals in my work (and elsewhere) has been to avoid paying tuition twice - for the same lesson. The following comments are aimed at sharing my experience with the Strand™ Index so that you can benefit from past lessons. The graph below is derived from real market activity in Seattle's urban, single family housing market. The explanations for the highlighted letters (A-G) follow the graph.
 A - The Strand™ Index numerical rating (Y axis). A reliable way of indexing the strength of the real estate market by quantifying supply and demand trends. Comparing it to thermometer, if we go outside to get a reading of the temperature, we learn how warm or cold it is now. If I ask, "what was the temperature yesterday?" …. you can tell me only if you took a reading then. If I ask, "what will it be tomorrow?"…. you can forecast based upon your prior experience and where things are at the moment. Every city has its own, unique, long and short-term real estate market cycles. Just like the calendar year, we know that things usually warm up in May and cool down in November. As time goes on, the user of the Strand™ Index will gain a much better understanding of their market's "environment" and have a much better sense of what to expect from their market place. B - The time line (X axis) reflects the market strength index over a period of time. A bar graph can portray the strength of one or more market segments as of a particular point in time. C - When the Strand™ Index rises, it indicates that demand is increasing, supply is decreasing, or both of these changes are under way. If, as an agent, you are pricing a listing, this is the market climate to be aggressive with your list price. If you are working with a buyer, and they submit a low-ball offer, chances are someone else will get the property. D - PRICES: After there is a shift in the market and the index falls, it is my experience that prices don't respond immediately and can continue to rise for two to eight+ weeks (here in Seattle) before the shift identified by the Strand™ Index is perceivable in the field. Accordingly, the index can be viewed as a "leading" market indicator, whereas prices are actually a lagging indicator of market conditions. E - If the index graph line heads down with a steep slope, there may be another week or two for a seller to be able to try to 'catch' a sale before they need to adjust the price. Most important is that, if a sale is not generated and a price reduction is warranted, the seller undercut the market with their pricing so that the market "meets" their price. Otherwise, the seller will be chasing the market down with small, incremental drops, spend much more time on the market, and very likely end up with less money when/if the property sells. F & G - F represents the bottom of a market cycle and G the peak of a cycle. Drawing on the thermometer analogy from above, it is my opinion that 'cool' or 'warm' markets can be just fine for all market participants. However, when the market gets too extreme, just like in the weather analogy, things can get scorched by the heat or damaged by the frost. Every market will experience its own long and short term cycles. It is impossible to know exactly what will happen to the market in the future. However, as time goes by, after gathering Strand™ Index market data for the regional or sub-markets in which you work, you will gain 1) a much better understanding of how your real estate market functions and 2) a valuable tool for forecasting market shifts for your clients.
Regards,
|
|
| ©1999-2009 R.E. Rothstein | |